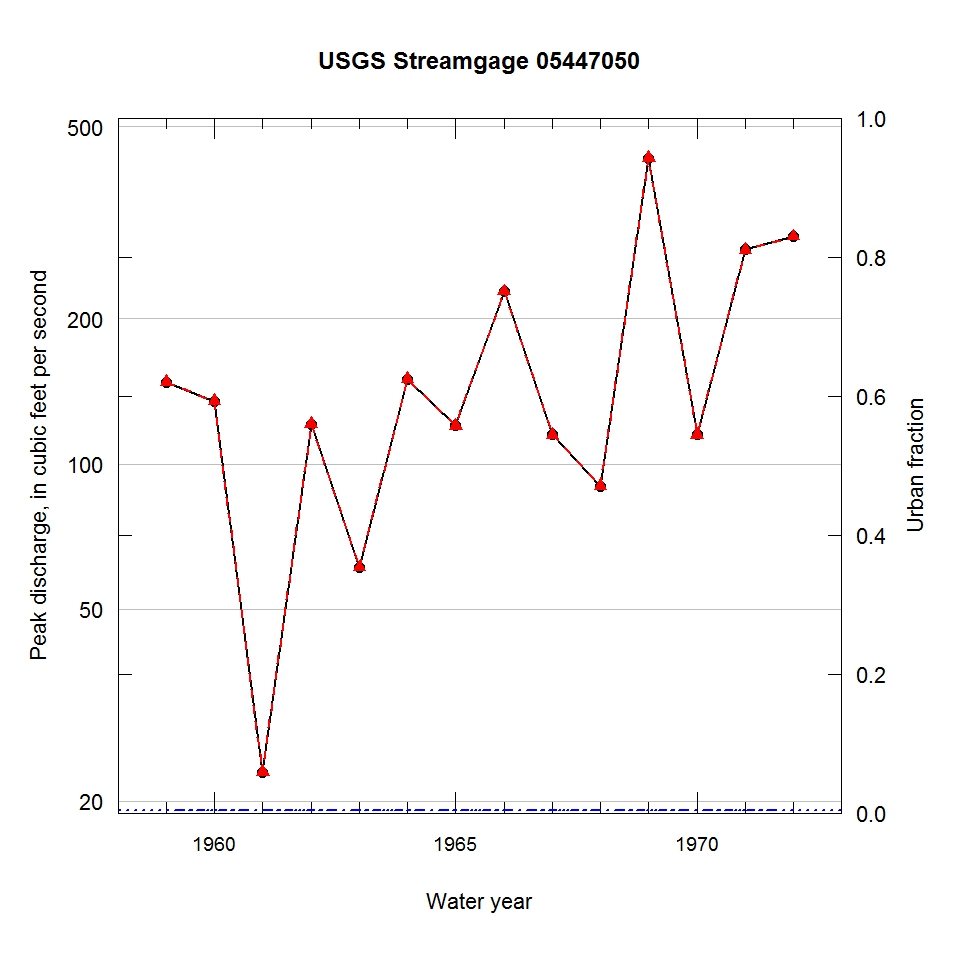
Observed and urbanization-adjusted annual maximum peak discharge and associated urban fraction and precipitation values at USGS streamgage:
05447050 GREEN RIVER TRIBUTARY NEAR OHIO, IL


| Water year | Segment | Discharge code | Cumulative reservoir storage (acre-feet) | Urban fraction | Precipitation (inches) | Observed peak discharge (ft3/s) | Adjusted peak discharge (ft3/s) | Exceedance probability |
| 1959 | 1 | -- | 0 | 0.003 | 0.738 | 148 | 148 | 0.456 |
| 1960 | 1 | -- | 0 | 0.003 | 1.216 | 135 | 135 | 0.522 |
| 1961 | 1 | -- | 0 | 0.003 | 2.263 | 23 | 23 | 0.982 |
| 1962 | 1 | -- | 0 | 0.003 | 1.025 | 121 | 121 | 0.604 |
| 1963 | 1 | -- | 0 | 0.003 | 0.467 | 61 | 61 | 0.882 |
| 1964 | 1 | -- | 0 | 0.003 | 1.089 | 150 | 150 | 0.447 |
| 1965 | 1 | -- | 0 | 0.003 | 0.807 | 120 | 120 | 0.608 |
| 1966 | 1 | -- | 0 | 0.003 | 1.471 | 228 | 228 | 0.190 |
| 1967 | 1 | -- | 0 | 0.003 | 0.573 | 115 | 115 | 0.632 |
| 1968 | 1 | -- | 0 | 0.003 | 1.522 | 90 | 90 | 0.758 |
| 1969 | 1 | -- | 0 | 0.003 | 1.392 | 431 | 431 | 0.030 |
| 1970 | 1 | -- | 0 | 0.003 | 1.671 | 115 | 115 | 0.632 |
| 1971 | 1 | -- | 0 | 0.003 | 0.388 | 278 | 278 | 0.110 |
| 1972 | 1 | -- | 0 | 0.003 | 0.136 | 296 | 296 | 0.090 |

